I. Introduction: The Foundation of Program Success
A successful extended warranty program is far more than a liability hedge; it is a powerful, predictable profit center and an indispensable driver of customer loyalty. By extending the brand relationship beyond the initial transaction, warranties transform transactional customers into long-term assets.
However, extracting this value requires moving past basic revenue tracking. We must define “Warranty Program Success” as a model that is both profitable and sustainable, with customer retention built into its core.
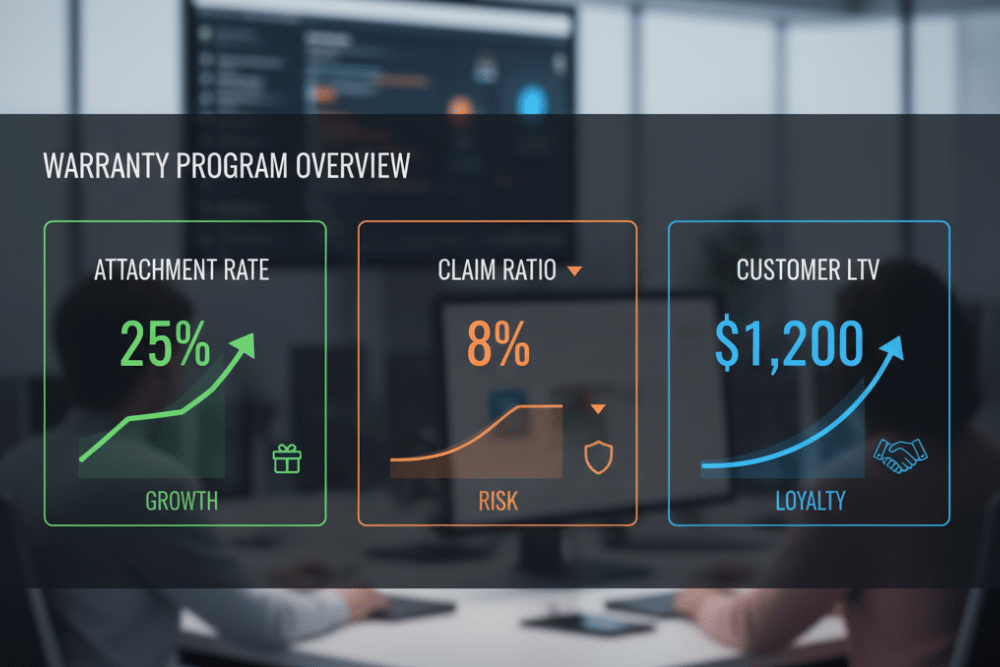
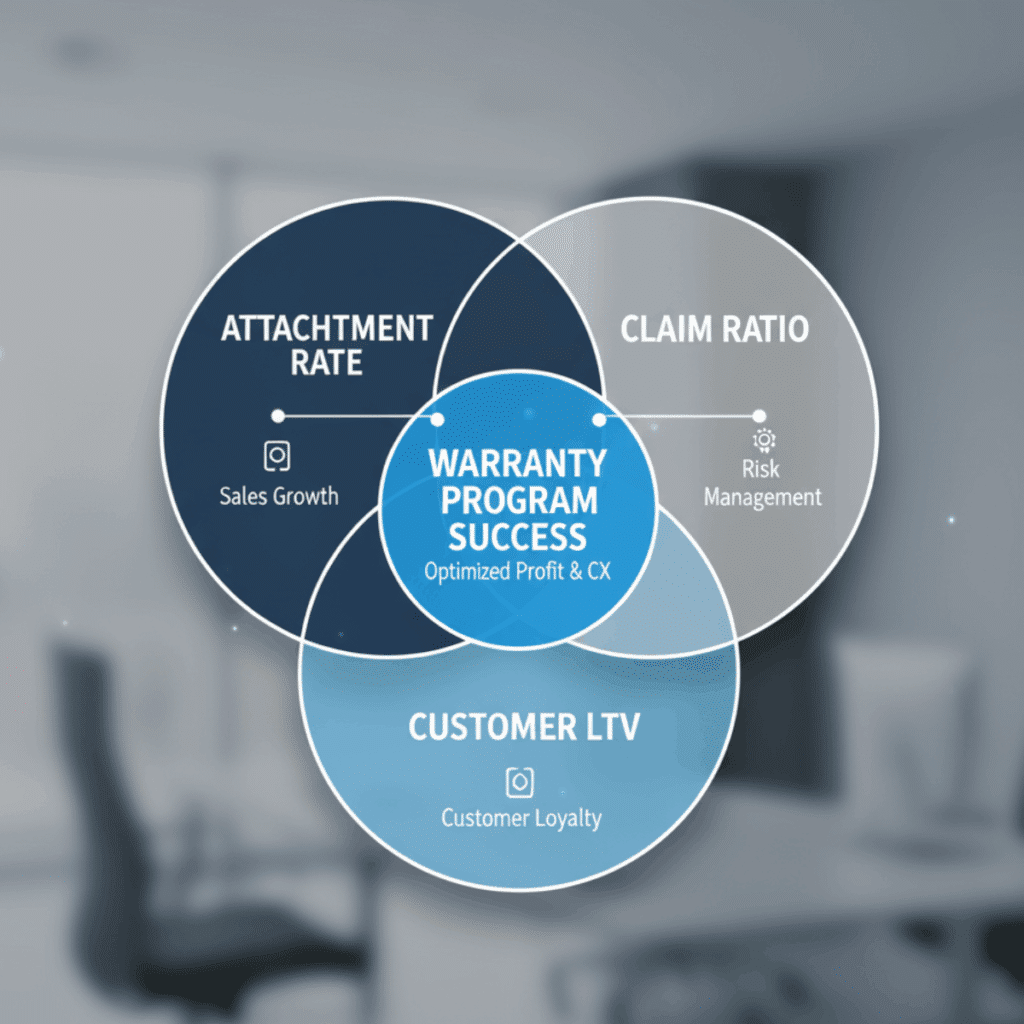
Thesis: True program success is measured by the balanced performance of three key indicators: Attachment Rate (Volume), Claim Ratio (Risk), and Customer Lifetime Value (LTV) (Profit). Mastering the interplay between these three metrics is the clearest path to unlocking a warranty program’s full potential.
II. Attachment Rate – The Growth Metric
A. Definition
The Attachment Rate is the percentage of eligible products or customers that successfully purchase or receive an extended warranty or protection plan at the point of sale (POS) or product registration.
B. Formula
Attachment Rate (%) = (Warranties Sold / Total Eligible Sales) x 100
C. Why It Matters
A high attachment rate directly drives immediate, low-cost revenue and expands the pool of covered products. This large pool is essential for spreading risk and ensuring a healthy initial contribution to the program’s financial reserves. Without this baseline, volatility increases, and underwriting becomes riskier.
D. Key Drivers of High Attachment Rate
- Seamless POS Integration: Must be frictionless within checkout or registration flows.
- Clear Value Proposition: Coverage terms and benefits must be simple and compelling.
- Sales Incentives: In retail or call center environments, training and incentives can boost attach rates by double digits.
- Tiered Pricing: Offering bronze/silver/gold options allows greater customer alignment.
Example: A U.S. electronics retailer increased its attachment rate by 22% after introducing a two-tiered coverage option during checkout.
III. Claim Ratio – The Risk and Profitability Metric
A. Definition
Claim Ratio measures the cost of claims paid out as a percentage of revenue generated from warranty sales.
B. Formula
Claim Ratio (%) = (Total Claims Paid / Total Warranty Revenue) x 100
C. Why It Matters
This is the ultimate profitability gauge. A claim ratio under 50% is generally considered strong, depending on product category. High ratios signal operational inefficiency, poor underwriting, or fraud.
D. Optimization Strategies
- Advanced Underwriting: Leverage real-time data from IoT, past failures, usage patterns.
- Automated Claims Workflow: Use API-driven platforms to validate claims, check eligibility, and route service dispatch in seconds.
- Fraud Management: AI-driven anomaly detection can cut non-covered claim costs.
- Service Cost Controls: Pre-negotiated service agreements keep repair costs predictable.
Data Point: According to Warranty Week, average U.S. consumer product claim ratios range from 12%–35%, depending on vertical (source).
IV. Customer Lifetime Value (LTV) – The Loyalty Metric
A. Definition
Customer Lifetime Value is the projected revenue a customer generates over their entire relationship with your brand.
B. LTV in Warranty Context
Warranty holders are more engaged, more loyal, and easier to retain. They’re likely to:
- Register products
- Buy extended plans
- Leave reviews
- Make repeat purchases
C. How Warranties Drive LTV
- Superior Claims UX: A smooth, fast, and branded claims experience reinforces loyalty.
- Behavioral Data: Registrations offer verified emails and purchase details for future targeting.
- Re-engagement Triggers: Policy renewal emails, upgrade offers, or post-claim upsells build lasting value.
Insight: A positive claim experience is a top driver of brand trust—more than speed of service, according to Cover Genius 2023 research (source).
V. Strategic Synthesis: Managing the Metrics in Tandem
The best programs are not those with perfect individual metrics, but those that maintain healthy performance across all three dimensions:
| Metric | Priority | Optimization Target |
|---|---|---|
| Attachment Rate | High | 10–50% depending on product class |
| Claim Ratio | Medium | Under 50% (variable by category) |
| LTV | High | Year-over-year revenue growth |
Trade-offs & Strategy
For example, increasing claim resolution speed may slightly raise operational costs—but significantly increases LTV. Programs must balance efficiency and customer satisfaction for long-term ROI.
Dashboard Approach
A real-time dashboard should display:
- Attachment rate by channel and SKU
- Average claim resolution time
- Policy renewal rate
- LTV growth rate by customer segment
VI. Conclusion: Metrics That Move the Needle
Measuring revenue is not enough. Success in 2025 and beyond requires a three-dimensional approach to performance: sell more (Attachment), manage risk (Claims), and deepen loyalty (LTV).
When balanced, these metrics deliver:
- Higher attach rates
- Lower service costs
- Increased renewals and upsells
Ready to track what actually matters? Book a free Warranty Program Metrics Consultation with All Shield today.
FAQs – Warranty Program Metrics
1. What is a good attachment rate in retail?
Industry average ranges from 4.9% to 50%, depending on category. Furniture and electronics can hit high double digits.
2. How can I reduce my claim ratio?
Use better underwriting models, automate claims workflows, and filter for fraud at intake.
3. What does LTV tell me in warranty programs?
It shows how much revenue a customer generates over time. High LTV justifies investments in service and retention.
4. Can these metrics be tracked in real time?
Yes—with platforms like All Shield, warranty analytics are exportable and updated in real-time.
5. Do I need all three metrics to evaluate success?
Yes. Focusing on only revenue or claim cost creates blind spots. True optimization comes from metric synergy.
6. What tools are needed to monitor these metrics?
Use a centralized platform with embedded analytics, CRM integrations, and configurable dashboards.
Facts & Statistics
- The global extended warranty market will exceed USD 240B by 2030, growing at CAGR 9.2% (IMARC).
- U.S. retailers saw attach rates of ~4.9% in Q2 2024 (Warranty Week).
- 60% of consumers prefer warranty offers at checkout (Cover Genius).